
I have been using Spotify since 2015, which at the time of writing puts me at around 9 years using Spotify. In order to comply with data privacy laws that have been enacted over the last several years, many companies have implemented ways for users to request their data. Spotify being among them, users are able to request lifetime listening history for their accounts under Privacy Settings. It takes a while for the data to be compiled, but eventually a download link is provided. I thought it would be fun to get my data and do some analysis on my listening history. I did this using Python, mostly with pandas (I will add a link to the repo eventually).
Uwrapping 2015-2023
Basic Stats
| Category | Total |
|---|---|
| Tracks | 34,316 |
| Artists | 9,917 |
| Minutes | 601,900 |
| Hours | 10,032 |
| Days | 418 |
Over the 9 year period, I spent at least 12.7% of my time listening to music.
| Track Finished | Track Not Finished |
|---|---|
| 76.7% | 23.3% |
On average, I skip one of every four songs.
Here’s a (not very pretty) plot of the total time I spent listening per day.
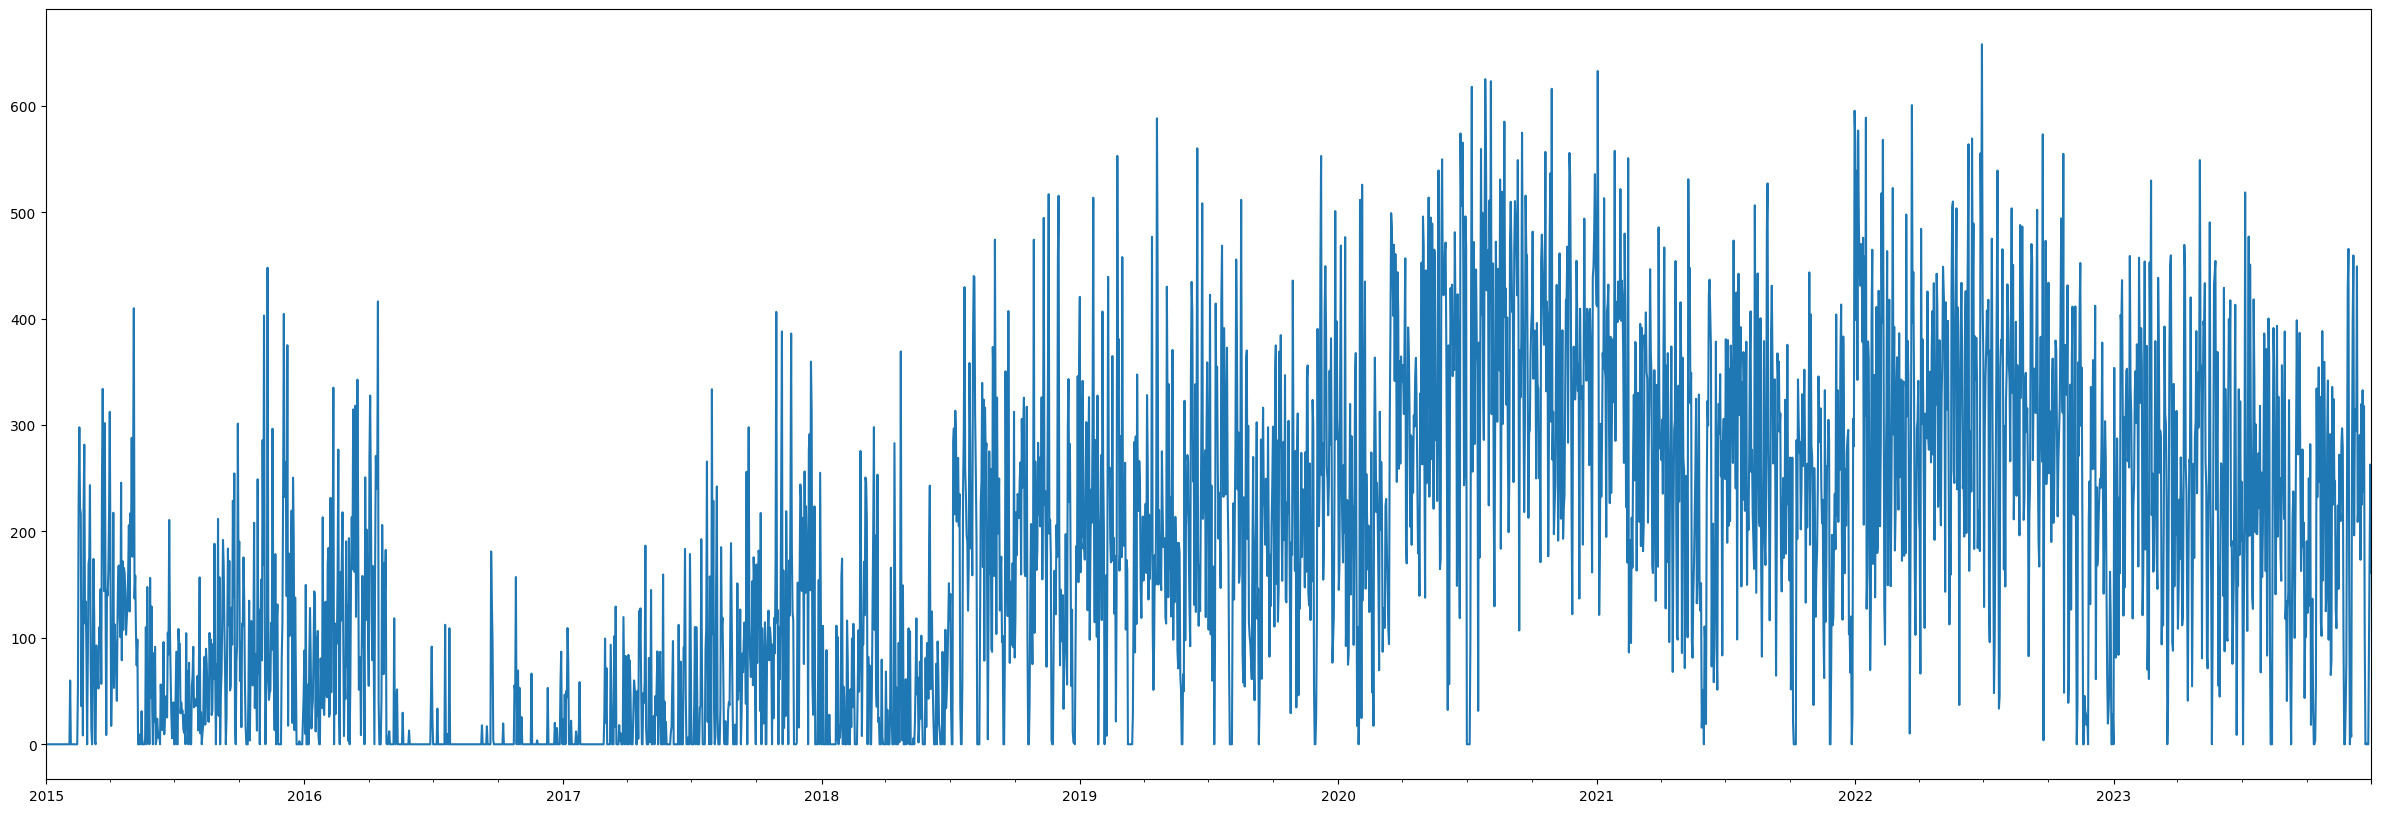
Here we can see a few interesting things:
- I barely used Spotify between around April of 2016 and January of 2017 (I was trying out local music storage and MusicBee).
- My listening time increased sharply when COVID hit in early 2020.
- There are many days that I listen to music for around 10 hours.
Top 10
Most-Played Tracks
| Track | Artist | Count |
|---|---|---|
| Cockroach En Fleur | Baroness | 116 |
| Seabeast | Mastodon | 102 |
| Quintessence | Mastodon | 97 |
| Red Rust | Zero 7 | 90 |
| Epoch | Tycho | 89 |
| Dragonaut | Sleep | 85 |
| Breakdown | Tom Petty and the Heartbreakers | 84 |
| Chasing Shadows | Santigold | 84 |
| Song of Solomon | Animals As Leaders | 84 |
| A Walk | Tycho | 83 |
The Baroness, Zero 7, and Tycho songs are on a playlist I use for my alarm clock, so no surprises there. The Santigold song got old a long time ago, but Spotify continues to play it in my shuffles. The rest are songs I do really like, but I would have guessed other songs to be above them.
Most-Played Artists
| Artist | Plays | … | Artist | Hours |
|---|---|---|---|---|
| Opeth | 3137 | — | Opeth | 352.5 |
| Tame Impala | 2541 | — | Tame Impala | 178.0 |
| Porcupine Tree | 965 | — | Porcupine Tree | 90.0 |
| The Black Keys | 960 | — | Steven Wilson | 77.3 |
| Courtney Barnett | 936 | — | Mastodon | 61.1 |
| Jimi Hendrix | 882 | — | Courtney Barnett | 58.8 |
| Mastodon | 817 | — | Tash Sultana | 56.0 |
| Steven Wilson | 809 | — | Jimi Hendrix | 55.5 |
| Grimes | 805 | — | The Black Keys | 52.3 |
| Tash Sultana | 790 | — | All Them Witches | 50.4 |
Opeth is far and away the winner in both categories, followed by Tame Impala. The rest look pretty even, but Porcupine Tree and Steven Wilson are both projects involving Steven Wilson, so adding those two together puts them closer to being on-par with Tame Impala.
Grimes and All Them Witches are the only artists that don’t make appearances through both lenses.
This plot shows the top 10 artists by time played.
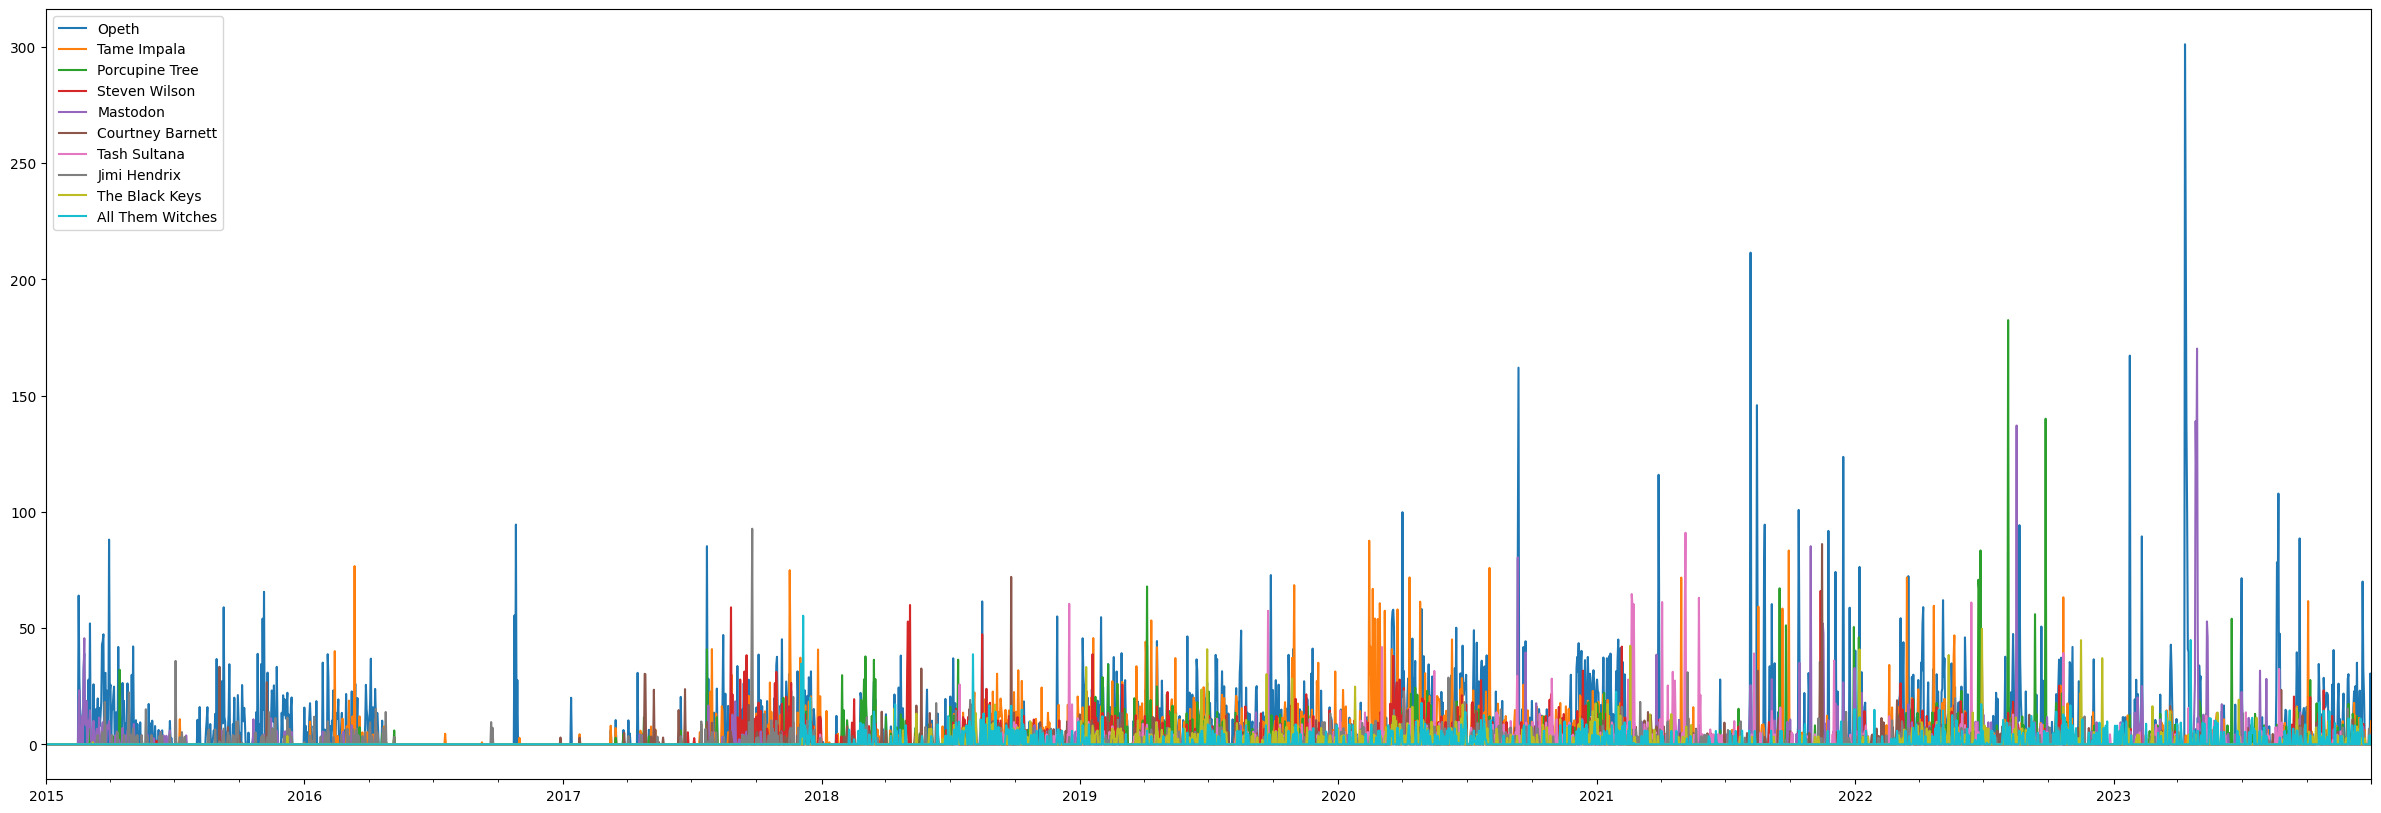
There is a day with 5 hours of Opeth, which seems insane until you realize that they have thirteen studio albums. Maybe it’s still insane, but I’ve recently been listening through artists' entire discographies. Mastodon followed shortly after.
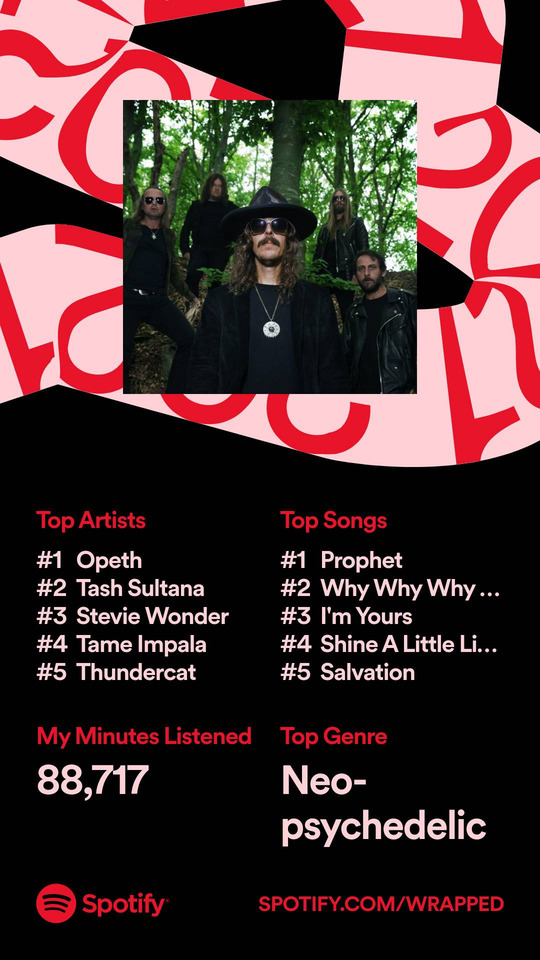
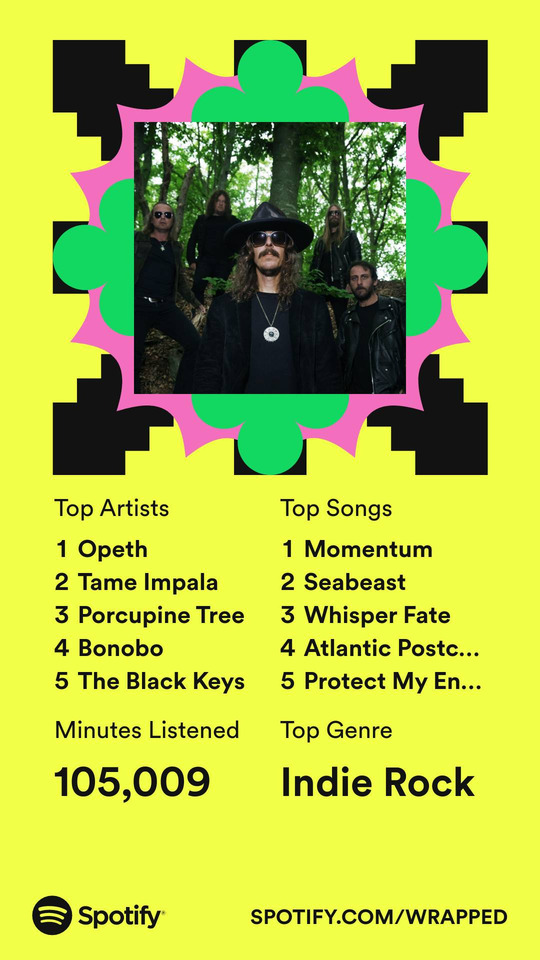
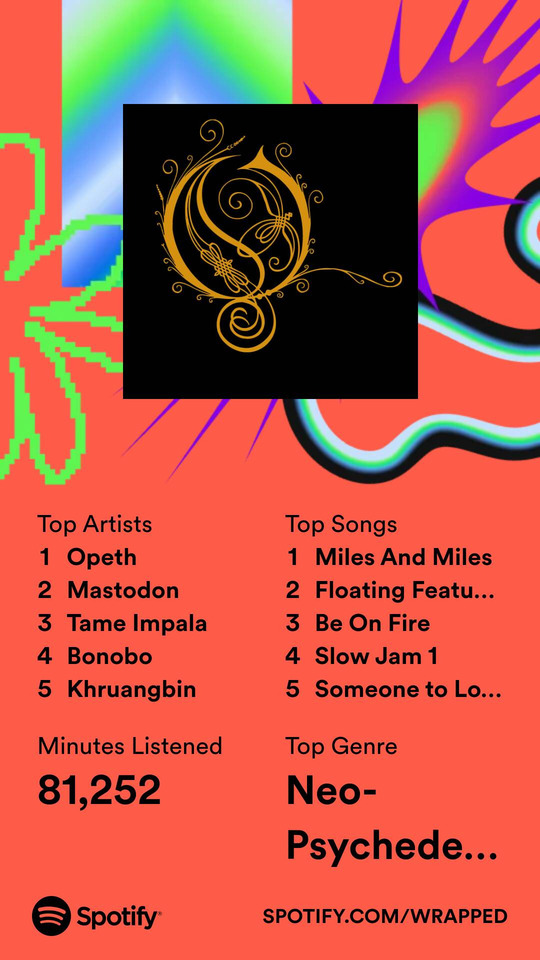
Comparison
I didn’t screenshot all of my past Spotify Wrapped summaries, but the last few years (2021-2023) closely match what would be expected from the more detailed analysis.
Future
Here are some ideas for deeper analysis that I’d like to try:
- Peak time of day/week/season for artists/genres (maybe with a heatmap)
- Break out top artists/tracks per year/month for closer comparison to Spotify Wrapped results
- Unique artists over time
- Nicer graphs